mirror of
https://app-learninglab.inria.fr/moocrr/gitlab/da84ababf0696af51bddad556af86353/mooc-rr.git
synced 2026-06-21 11:35:27 +02:00
3.6 KiB
3.6 KiB
Exo 2 Python
Import des données
import numpy as np

dataSource = np.array([14.0, 7.6, 11.2, 12.8, 12.5, 9.9, 14.9, 9.4, 16.9, 10.2, 14.9, 18.1, 7.3, 9.8, 10.9,12.2, 9.9, 2.9, 2.8, 15.4, 15.7, 9.7, 13.1, 13.2, 12.3, 11.7, 16.0, 12.4, 17.9, 12.2, 16.2, 18.7, 8.9, 11.9, 12.1, 14.6, 12.1, 4.7, 3.9, 16.9, 16.8, 11.3, 14.4, 15.7, 14.0, 13.6, 18.0, 13.6, 19.9, 13.7, 17.0, 20.5, 9.9, 12.5, 13.2, 16.1, 13.5, 6.3, 6.4, 17.6, 19.1, 12.8, 15.5, 16.3, 15.2, 14.6, 19.1, 14.4, 21.4, 15.1, 19.6, 21.7, 11.3, 15.0, 14.3, 16.8, 14.0, 6.8, 8.2, 19.9, 20.4, 14.6, 16.4, 18.7, 16.8, 15.8, 20.4, 15.8, 22.4, 16.2, 20.3, 23.4, 12.1, 15.5, 15.4, 18.4, 15.7, 10.2, 8.9, 21.0], dtype=np.float64)
print(dataSource)
[14. 7.6 11.2 12.8 12.5 9.9 14.9 9.4 16.9 10.2 14.9 18.1 7.3 9.8 10.9 12.2 9.9 2.9 2.8 15.4 15.7 9.7 13.1 13.2 12.3 11.7 16. 12.4 17.9 12.2 16.2 18.7 8.9 11.9 12.1 14.6 12.1 4.7 3.9 16.9 16.8 11.3 14.4 15.7 14. 13.6 18. 13.6 19.9 13.7 17. 20.5 9.9 12.5 13.2 16.1 13.5 6.3 6.4 17.6 19.1 12.8 15.5 16.3 15.2 14.6 19.1 14.4 21.4 15.1 19.6 21.7 11.3 15. 14.3 16.8 14. 6.8 8.2 19.9 20.4 14.6 16.4 18.7 16.8 15.8 20.4 15.8 22.4 16.2 20.3 23.4 12.1 15.5 15.4 18.4 15.7 10.2 8.9 21. ]
Partie 1&2
La moyenne :
print(np.mean(dataSource))14.113000000000001
Le minimum :
print(np.min(dataSource))2.8
Le maximum :
print(np.max(dataSource))23.4
La médiane :
print(np.median(dataSource))14.5
L'écart-type :
print(np.std(dataSource, ddof=1))4.334094455301447
Partie 3
import matplotlib.pyplot as plt
import numpy as np

w = np.arange(0, len(dataSource))
fig1 = plt.figure(figsize=(5,5))
plt.plot(list(w), list(dataSource), 'b-')


# Parameters
plt.grid(True)
plt.tight_layout()
plt.xlim(0,100)
plt.ylim(0,25)

plt.savefig(matplot_lib_filename)
matplot_lib_filename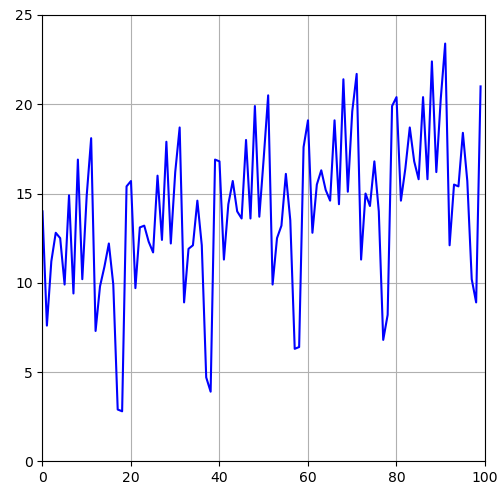
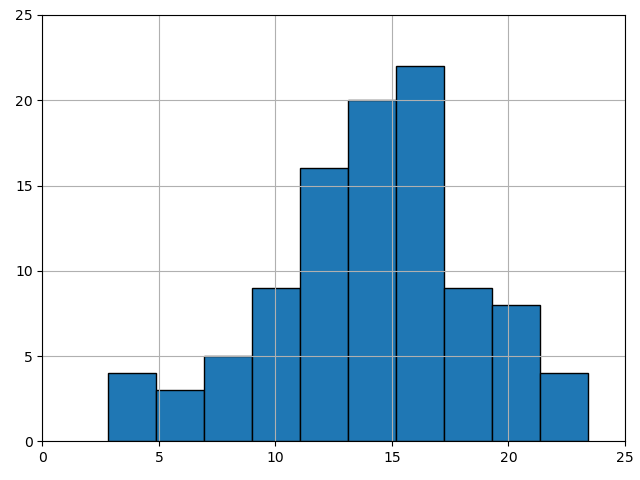
import matplotlib.pyplot as plt
import numpy as np

# Actual plot
fig1 = plt.figure()
plt.hist(list(dataSource), edgecolor='k')

# Parameters
plt.grid(True)
plt.tight_layout()
plt.xlim(0,25)
plt.ylim(0,25)

# Export the picture
plt.savefig(matplot_lib_filename)
matplot_lib_filename